
Microseismic monitoring of MultiStage Hydraulic Fracturing on the base of the Short Term MicroSeismicPRM (ST-MSPRM) method
Method. Microseismic Monitoring of MultiStage Hydraulic Fracturing (MSHF) at the hydrocarbon deposit shall be performed by means of microseismic emission registration at the daylight surface with a low-aperture antenna located in the epicentral area of the emission sources and specialized data processing by means of cluster calculations.
Registration. The used microseismic monitoring scheme supposes control over all process operations at the well, including 24 hours before the MSHF start and 24 hours after the MSHF end. The field team mobilization time amounts to 10 days, demobilization time – 3 days.
Equipement. Field works shall be performed by means of digital seismic stations equipped like Scout (Fig. 1) with 1C GS-One seismic sensors or similar. The equipment should ensure the registration of data with the following parameters:
- record synchrony with a tolerance of not more than 100 microseconds,
- sampling frequency of more than 1 kilohertz,
- operating frequency range of 5-200 HZ,
- registration continuity of up to 28 days.
The used differential GPS-receiver allows to measure relative coordinates of seismic sensors with a high accuracy.
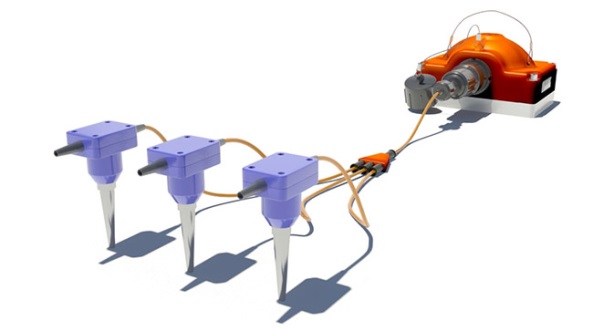
Figure 1. Three-Channel Digital Seismic Scout Station, equipped with GS-One seismic sensors.
Data acquisition system. Antenna consists of seismic sensors (antenna aperture approximately amounts to 1000 meters), sensors shall be penetrated to the depth of 1-2 meters depending on the geological conditions. Distinguishing features of the observation method (Fig. 2) consist in high mobility, fast deployment, high resolution, low cost of receipt, transfer, and processing of microseismic data. The distance between the sensors should be about 50 meters.
Typical sizes of array are of the order of 1000х1000 meters. The number of vertical sensors is 400. For time sampling of signal equal to 0.5 ms, the depth of monitoring can be from 700 to 5000 meters.
The array will be able to monitor the MSHF in 7 parallel horizontal wells with a length of 1 km and located at a distance of about 300 meters from each other (Fig.2.)
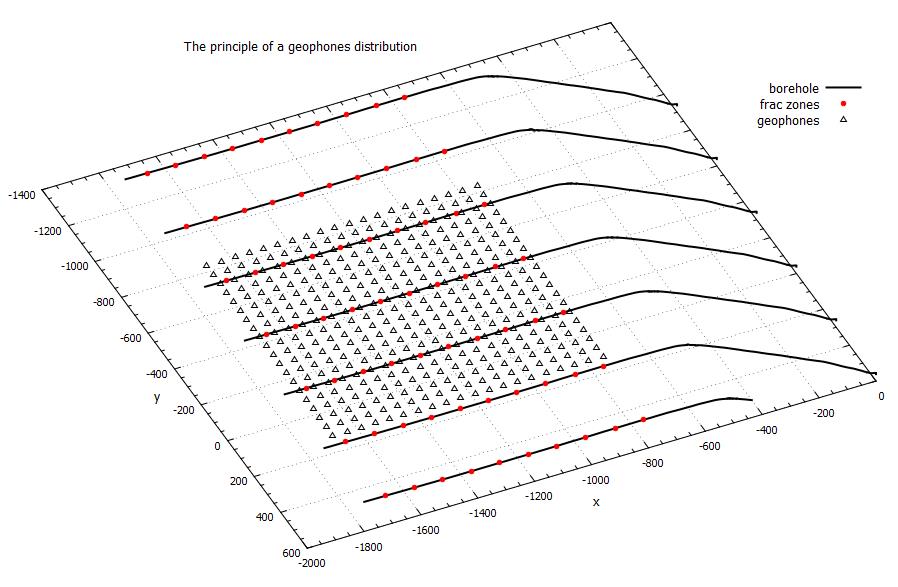
Figure 2. Data acquisition system
Tasks solved upon MSHF monitoring:
- Determination of the length and bearing angle of the fractured zone
- Visualization of the fractured zone development in time
- Determination of energy parameters of microseismic events and pumping down process
- Visualization of the microseismic activity zone
- Maps of energy density
- Analysis of MSHF stages based on calculation of energetic parameters
Monitoring results. Kinematic characteristics of events. One of the main tasks of hydraulic fracturing monitoring consists in determination of the geometric parameters of the fracturing zone forming as a result of monitoring of fracturing treatment in the well. Such parameters as fracturing zone length and its bearing angle shall be assessed according to microseismic event hypocentres registered in course of monitoring. An example of assessment of the fracturing zone limbs and the bearing angle of its distribution is shown in Fig.3 For a deeper understanding of the fracture formation processes, the technology allows to visualize the process of the active microseismic zone formation not only in a static variant (Fig. 4), but also in a form of an interactive video playback.
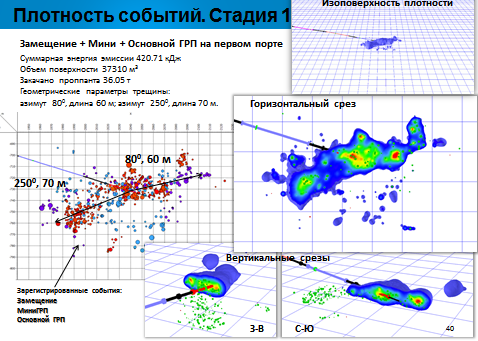 Figure 3. – Chart of the registered microseismic events in course of substitution stages production, the minimal monitoring of fracturing treatment and the major monitoring of fracturing treatment (1 port) projected onto the daylight surface; the events dimensions are proportionate to their energy; the coordinate system beginning is combined with the collar of the well, the color corresponds to the registration time: violet – substitution stage, light blue – stage of minimal monitoring of fracturing treatment, red – stage of major monitoring of fracturing treatment. |
Monitoring results. Dynamic characteristics of events. Each microseismic event is described by a set of parameters. Besides the coordinates and the time of the microseismic event occurrence, energy parameters are determined (absolute energy, magnitude, energy of isotrope compaction/extention deformation, energy of maximal separation/compaction/shift tension, etc.) Energy parameters are calculated based on the seismic moment tensor which may be presented in the main axes in a form of three perpendicular vectors.
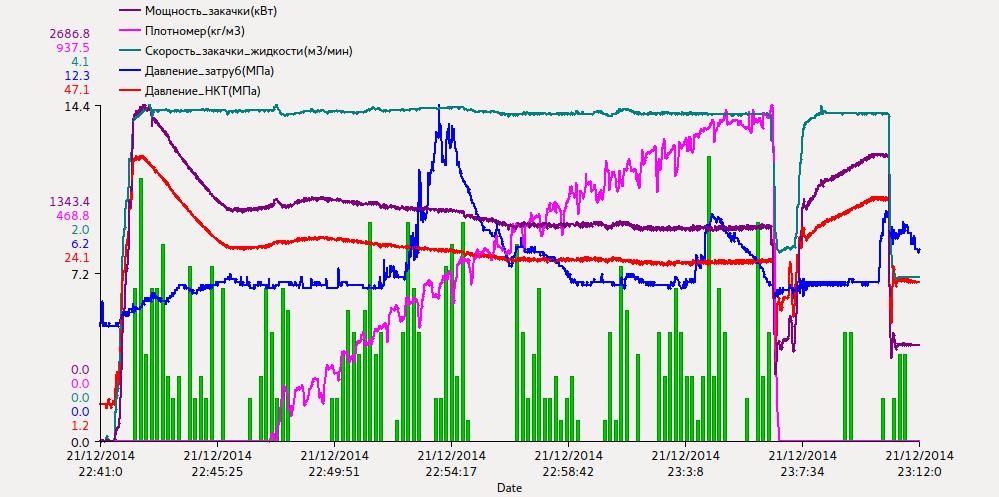 |
Figure 4. Histogram of the registered microseismic events according to the time of major monitoring of fracturing treatment, combines with technological processes charts (tubing pressure chart is highlighted by red, pressure in the backside – blue, liquid flow rate – green, proppant concentration as per density gauge – pink, pumping down capacity – violate).
Calculation of the microseismic events density allows to build a contour of the microseismic activity zone (Fig. 5). In the section of this zone, microseismic energy density can be observed (Fig. 6).
Figure 5. Isosurface of density of microseismic events, registered in course of the first MSHF stage; grid size amounts to 25 meters; the isosurface contains 95% of the microseismic emission energy
Figure 6. Horizontal slice of energy density of the microseismic events, registered in course of substitution stages, the minimal monitoring of fracturing treatment and major monitoring of fracturing treatment; grid size amounts to 25 meters;
In Fig.7, distribution of microtensions in the zone of microseismic emission formation is presented with directions of the main tension axes (seismic moment tensor) in course of monitoring of fracturing treatment. In the figure, the maximal value of the seismic moment tensor is specified, linear dimensions are proportionate to the energy.
Figure 7. Direction of the main tension axes (tensor) for each micro event upon monitoring of fracturing treatment; grid size amounts to 25 meters
Comparative characteristics of the MSHF stages. Assessment of the pumping down capacity is performed as per technological processes charts (Fig. 4). Calculation of the general pumping down energy for liquid and proportion of microseismic energy to the general pumping down energy characterizes various stages of fracturing treatment monitoring and allows to compare these data to each other. Thus, Рис. 9 shows imbalance of the isotope extension and compaction (P) deformation energy for various MSHF stages. Figure 10 shows comparative images of stages of the 7-stage fracturing treatment monitoring.
Figure 8. Percentage ratio of the cumulative emitted seismic energy and the pumping down energy for various MSHF stages
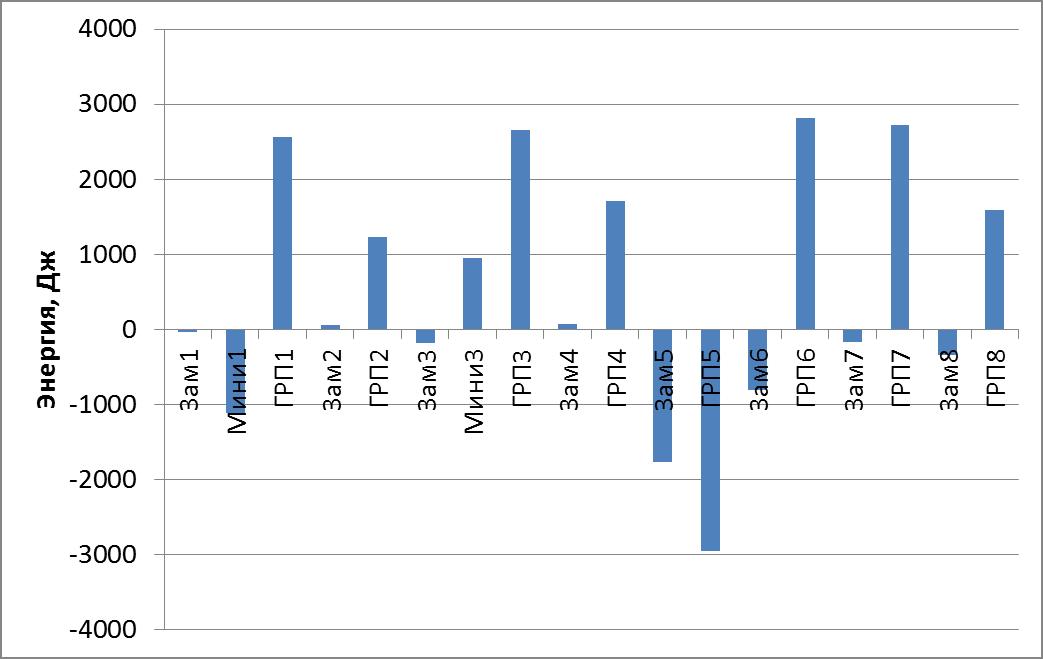 Figure 9. Non-compensated part of the isotrope extension and compaction (P) deformation energy for various MSHF stages
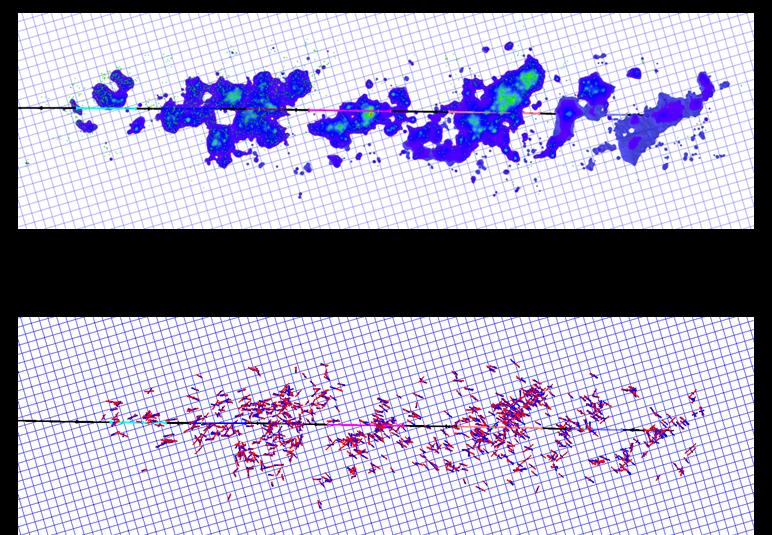
Figure 10. Result of the MSHF microseismic monitoring on the energy isosurfaces in the form of horizontal projections of the main tension axes
Monitoring of filtration activity. Presently, methods of production in the horizontal wells with the use of multistage hydraulic fracturing have been widely applied. Traditionally, microseismic monitoring is applied to control over MSHF, however, such application does not provide information on the quality of work of separate ports. Microseismic monitoring based on ST-MSPRM method performed after MSHF (Figure 11-12) allows to record microseismic activities near producing ports. Results of surveying the influxes in the well showed that only the last 3 ports near which microseismic activity is observed have a well performance.
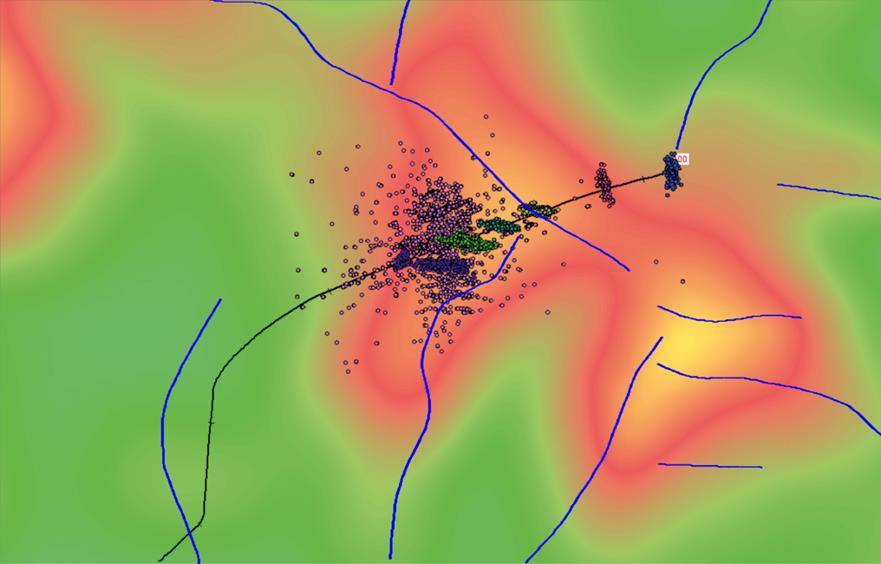
Figure 11. Structural chart with plotted faults and microseismic events, registered in course of MSHF and passive monitoring (lilac). Bazhen formation.
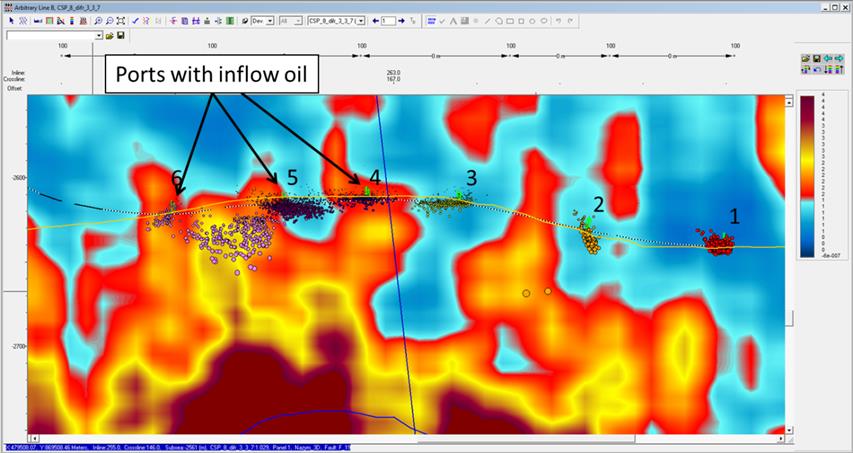
Figure 12. Vertical slice of the cube of scattered waves along the profile line passing trough the horizontal well. Bazhen formation.
The method ST-MSPRM used since 2002. Tested on 85 oil fields.
PDF Version: