The results of 3D seismic data processing and interpretation using the CSPD method are presented as examples for oil deposits of the Western Siberian oil-and-gas region.
Oil deposits are located in carbonaceous rocks of the Devonian basement and confined to its upper parts. The reservoir is of fractured type. Deposits are massive and not controlled structurally. The filtration properties of the reservoir are distinctively laterally and vertically related. Maximum oil inflows are given from organic limestone.
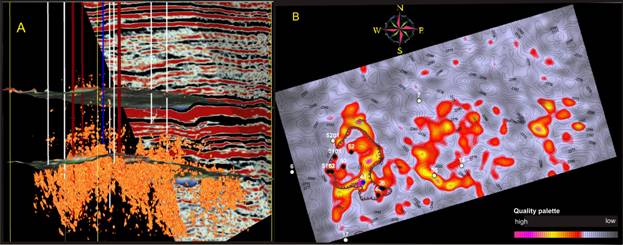
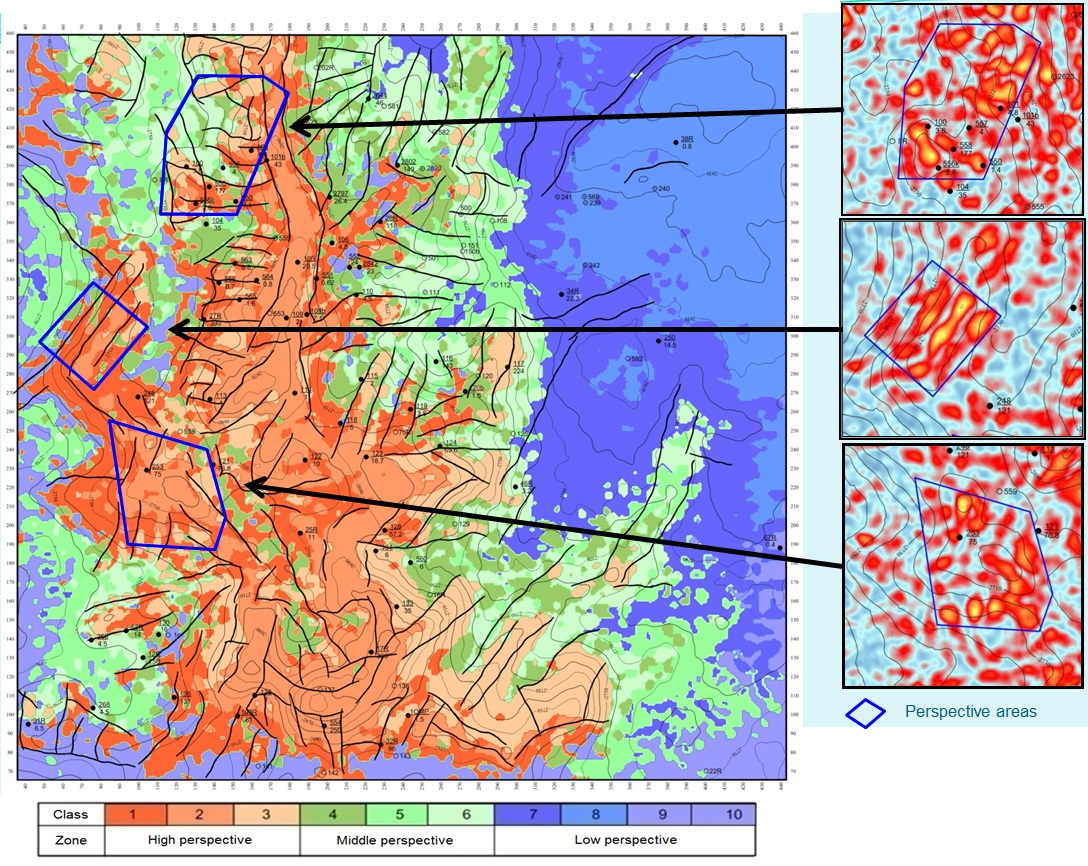
Figure 1. A – CSP-diffractor and CSP-reflector cube combination. B – forecast map of reservoir distribution zones (wells with inflows of oil – brown, water – blue, without inflow – white).
The predicted thickness of the reservoir varies from 0 to 100 m. The left part of figure 1 shows the combination of CSPD-diffractor and CSPD-reflector cubes. Here and further on the diffractors are presented in red. The right part contains the forecast map of reservoir distribution zones in the customary format.
Oil deposits are located in carbonaceous rocks of the Devonian basement complex and are confined to its upper parts. At the top of the basement there is weathering crust. The fractured reservoirs are located in the weathering crust and unweathered rocks. The thickness of the reservoir varies from 0 to 200 m. The reservoir is lithologically screened. The left part of figure 5 shows the combination of CSPD-diffractor and CSPD-reflector cube. The right part contains the forecast map of fractured reservoirs.
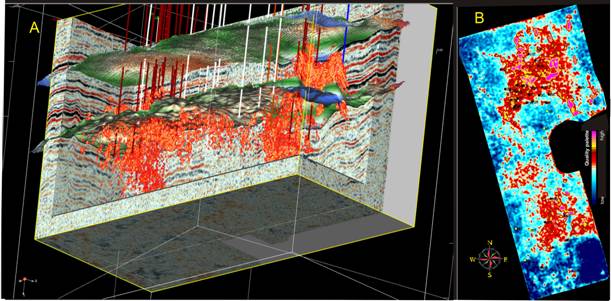
Figure 2. A – CSP-reflector and CSP-diffractor cube combination. B – forecast map of reservoir distribution zones (wells with inflows of oil – brown, water – blue, without inflow – white).
Oil deposits are located in two productive horizons: in the upper Jurassic and in the basal complex rocks. The basal complex contains effusive rocks both core basal and persilicic, shale rocks and porphyries. At the top of the basal complex (the first 10 meters thick) there is mantle of waste with no reservoirs. In the unweathered rocks the reservoir is cavernous fractured. The reservoir thickness varies between 0 and 50 meters. The deposits are lithologically screened. The upper Jurassic horizon is composed of argillaceous rocks with carbonaceous and siliceous intercalations. The total thickness of these intercalations varies between 3 and 10 meters. The reservoir is formed mainly within these intercalations and is cavernous fractured. The deposits are facially controlled and tectonically screened.
For a more detailed description of reservoir composition in this oilfield see figures 3 -7.
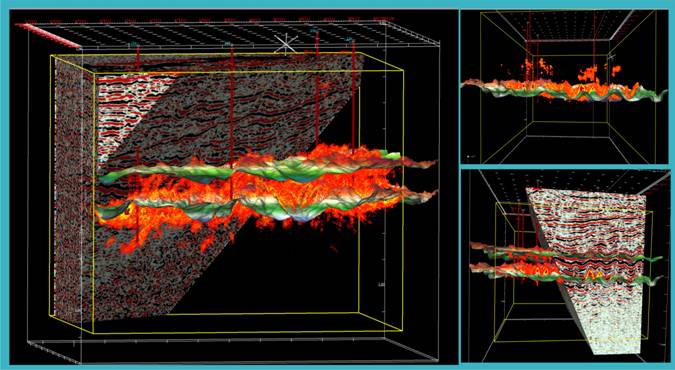
Figure 3. CSPD-reflector and CSPD-diffractor cube combination. The reservoir is formed by the basal complex rocks (effusive rocks, shale rocks and porphyries) and by the upper Jurassic argillaceous rock. The reservoir type is cavernous fractured. The four wells drilled due to the forecast have had oil inflow.
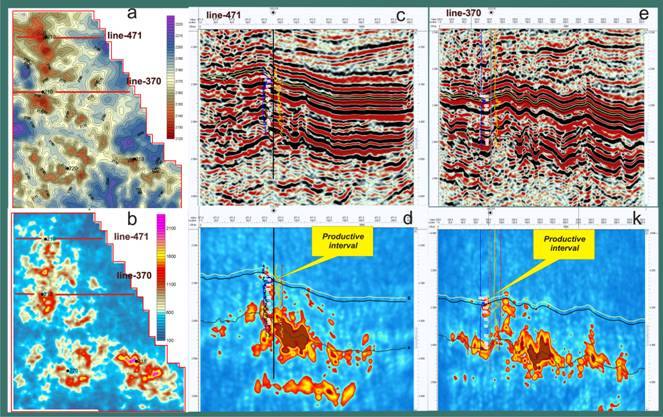
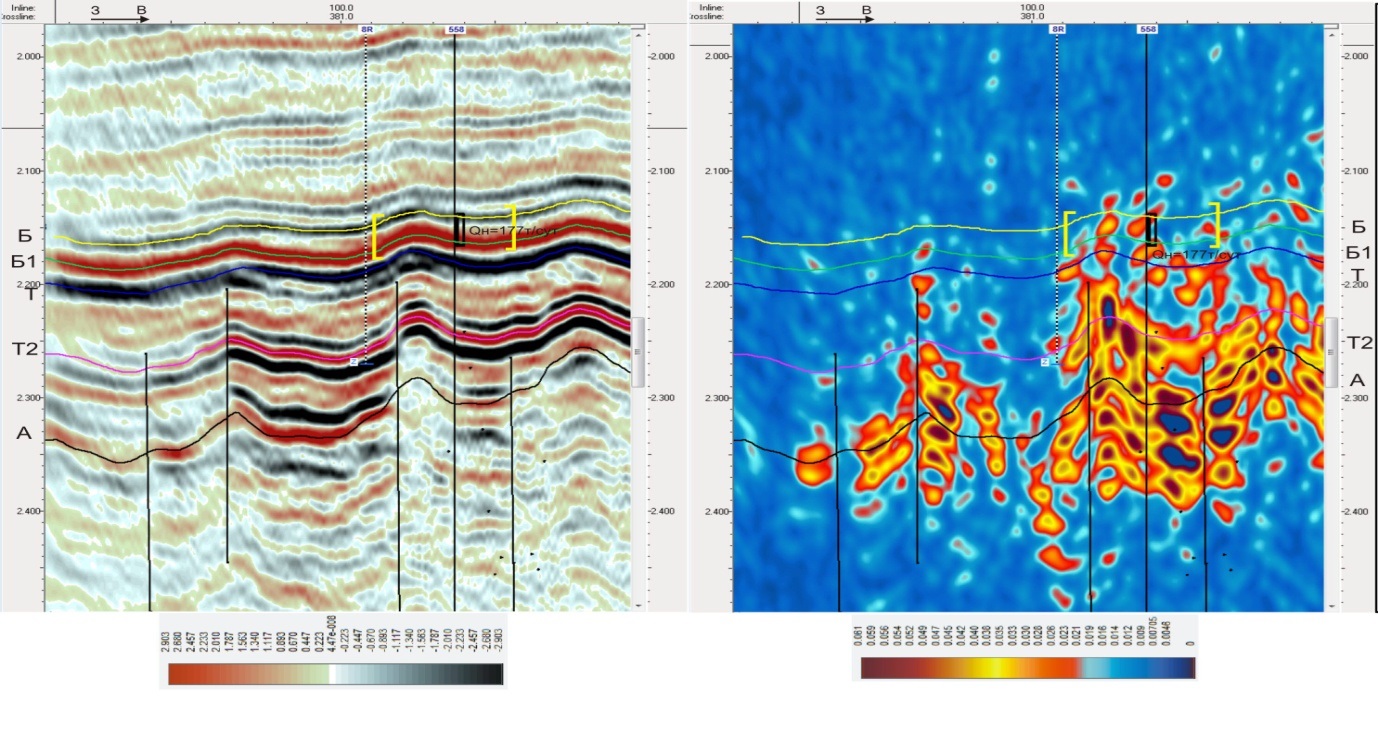
Figure 4. Presence of cavernous fractured reservoirs in the CSPD-reflector and CSDP-diffractor sections: a – subsurface contour map for the upper Jurassic top, b – the upper Jurassic reservoir qualities map. Comparison of time sections for CSPD-reflector /471 (с) – 370 (e) lines between wells 219 and 210/ and CSPD-diffractor (d) and (k) sections.
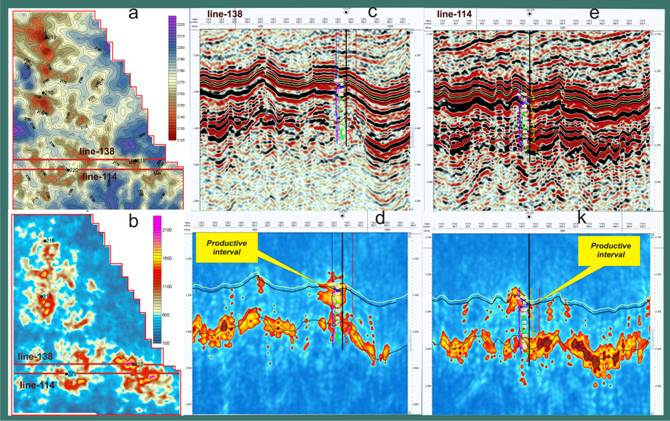
Figure 5. Presence of cavernous fractured reservoirs in the CSPD-reflectors and CSPD-diffractor sections: a – subsurface contour map for the upper Jurassic top, b – the upper Jurassic reservoir qualities map. Comparison of time sections for CSPD-reflector /138 (с) – 114 (e) lines between wells 218 and 220/ and CSPD-diffractor (d) and (k) sections.
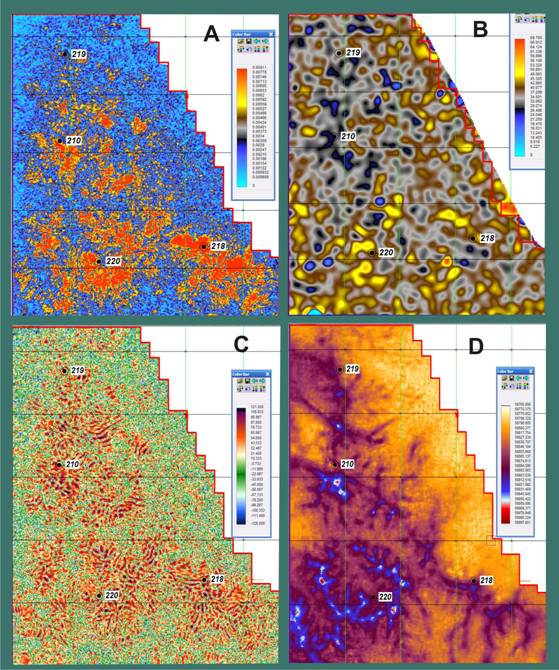
Figure 6. CSPD-diffractor attribute parameter map for the upper Jurassic reservoir. A – instantaneous amplitude map, B – instantaneous frequency map, С – coherency map, D – impedance map.
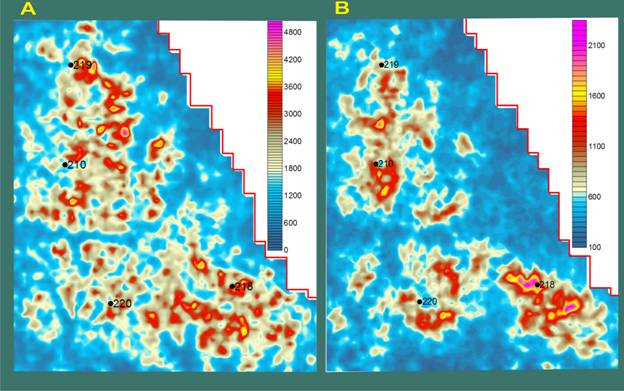
Figure 7. A – CSPD-diffractors amplitude map for the basal complex rocks, B – CSPD-diffractors amplitude map for the Jurassic reservoir.
The Bazhen formation is of Upper Jurassic age and is composed of bituminous shale (clay) rocks with carbonate and siliceous intercalations. This formation has rich organic content. Its oil reserves are estimated to be from 5 to 7 billion tons. Though 135 oil deposits in 54 oilfields were discovered to date in the Bazhen formation, these discoveries have a more occasional than systematic character. One of them is an oilfield discovered in 1965, when oil inflow with production rate about 600 cubic meters per day was obtained from the Bazhen formation. Up to the present more than 200 wells have been drilled on the oilfield. However, logging investigations and conventional 3D seismic methods have not been able to reveal a rule for reservoir location in the Bazhen formation neither in area nor in depth.
In Figure 8, the Bazhen formation map of diffractors is displayed. The diffractor level, which distinguishes reservoirs from the non-fractured zone, was calibrated using the results of well testing. Since there are no wells with water inflow from the Bazhen formation, all high amplitude diffractor anomalies are interpreted as oil reservoirs. In Figure 8, most productive wells (60%) are located in zones with high diffractor amplitude. In Figure 9, typical reflector (left) and diffractor (right) time sections are displayed.
For further interpretation a fault block model, using both diffractor and reflector cubes, was built. Within the oilfield, faults crack not only the Bazhen formation but the upper and lower caprock layers as well. If the upper caprock layer is corrupted – the oil will migrate to lower Cretaceous sandstones. If the lower caprock layer is corrupted – the oil, due to anomalous high differential pressure, will migrate to middle Jurassic sandstones. To take this into account, cluster analysis was done with diffractor maps of the Bazhen, lower Cretaceous, and middle Jurassic layers and a structural map of the Bazhen formation. The area was divided into 10 classes which were joined into 3 zones: high, middle and low perspective – Figures 8 – 10. Cluster analysis increases the location of productive wells in the perspective zone up to 80%.
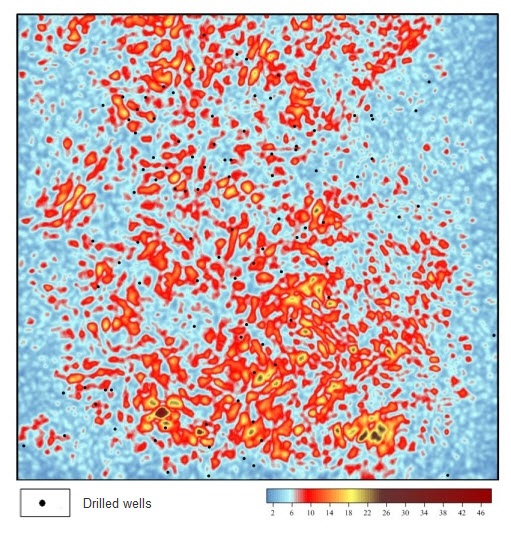
Figure 8. Diffractor map of the Bazhen formation